Some people will tell you that trends “move in waves.” They will say, for example, that up trends are made of a series of higher highs and higher lows, like this:
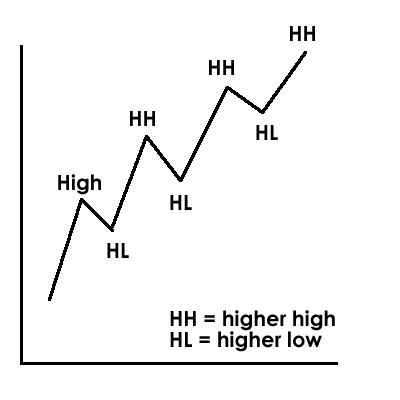
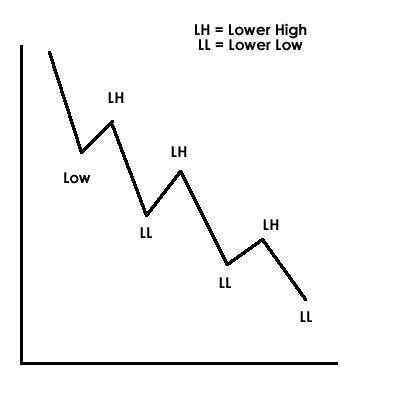
And a downtrend is just the opposite (a series of lower lows and lower highs).
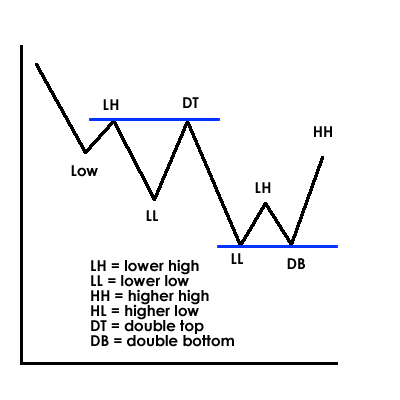
Now that’s cool and it makes sense, but there are two other things price can do: make double tops and double bottoms (when a high is the same as a previous high and when a low is the same as a previous low):
As far as this kind of price action is concerned, those are all the possibilities you can have.
Conventional thinking will tell us that higher lows, for instance, are bullish because they mean price was unable to break the previous low before going back up.
Double tops are likely to be bearish because it means price was unable to break above the previous high (and you could also look at it as price bouncing off of previous resistance, which is bearish).
Double bottoms are likely to be bullish because it means price was unable to go beneath the previous low (and you could also look at it as price bouncing off of previous support, which is bullish).
Now, is this enough off of which to build a trading system?
There are a few problems with this. Let’s say you were going to trade an uptrend that was formed by HHs and HLs. Price starts going up and forms a high, and then it starts retracing.
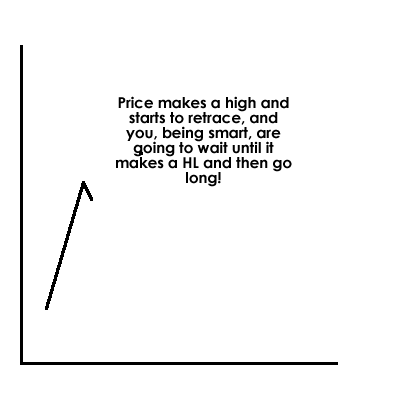
You are going to wait for the HL and then go long, but there is a problem: how do you know when price is done retracing and is going to go back up? How do you know that retrace isn’t going to keep going down and form a lower low?
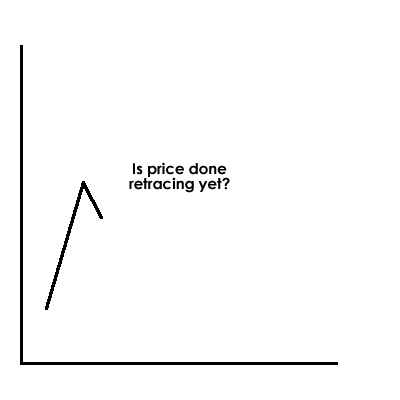
Did you enter yet?
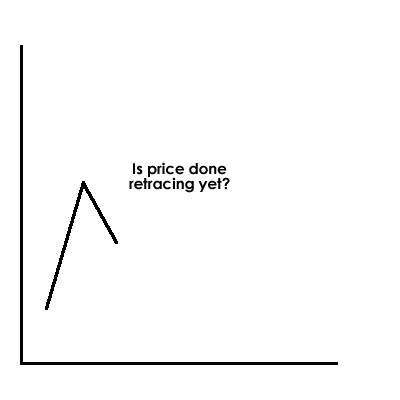
Did you enter yet?
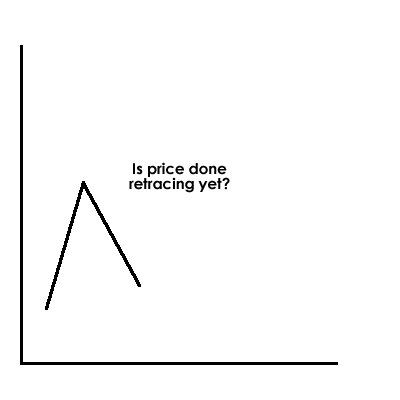
Did you enter yet?
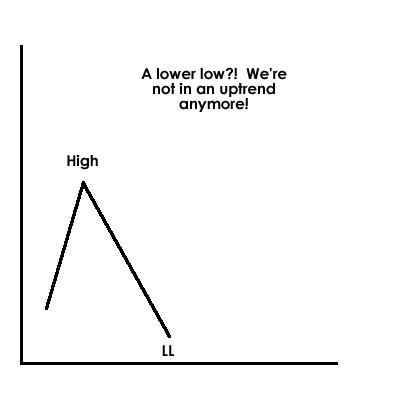
Oh no, price formed a lower low! Looks like we’re not in an uptrend anymore.
Now we should be looking for a lower high to confirm the downtrend, right?
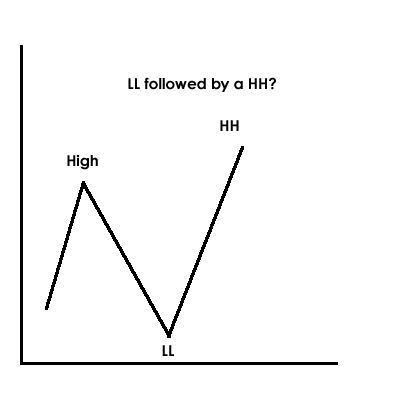
A LL followed by a HH?! How does that happen?!
People will come up with all sorts of rules, like:
- don’t enter long until a high, a HL, and another HH (this is supposed to “confirm” the uptrend)
- don’t enter long after more than 3 waves (as if after making 3 HHs, price won’t make another HH)
All of these rules are just things people make up because they don’t understand the random price of the market.
Sometimes price trends and makes beautiful HHs, HLs, and HHs. If you can figure out when to enter (because the HL can form at any point), you can make money as long as you get out before price goes against you. Be careful adding to winning trades because as soon as that retracement goes a bit too far, your winning trade can turn into a losing trade.
Sometimes price makes LL, HH, LL.
Sometimes price makes HL, LH, HL.
Price can do whatever it wants and doesn’t care what it has done in the past.
You will see people chime in on these kinds of discussions and say “well obviously you just don’t understand it” subtly implying that they do understand it, yet you will never see them make real time calls. I wonder why?
Price can go wherever it wants, and unless you know ahead of time that it’s going to make a LH or whatever, there’s no way to know that a HL will follow a HH. Here is a list of possible formations that can follow a HH:
- HL
- DB
- LL
(obviously a LH can’t follow a HH because a LH is formed when price is rising and if you’re already at an HH you can’t have a LH without some sort of low coming first).
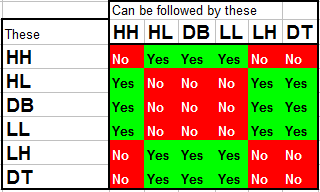
Here’s a chart showing what can follow what. Start with the vertical column and go across to see if a certain formation can follow it.
0 comments:
Post a Comment