Thursday, September 3, 2015

Higher High? Higher Low? Lower Low? Lower High?

Some people will tell you that trends “move in waves.”  They will say, for example, that up trends are made of a series of higher highs and higher lows, like this:
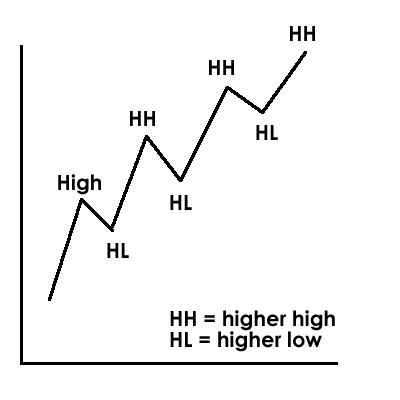
uptrend
And a downtrend is just the opposite (a series of lower lows and lower highs).
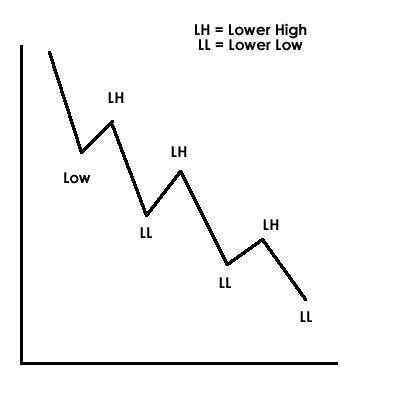
downtrend
Now that’s cool and it makes sense, but there are two other things price can do: make double tops and double bottoms (when a high is the same as a previous high and when a low is the same as a previous low):
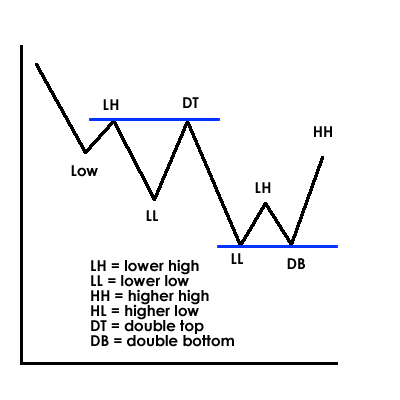
double tops and bottoms
As far as this kind of price action is concerned, those are all the possibilities you can have.
Conventional thinking will tell us that higher lows, for instance, are bullish because they mean price was unable to break the previous low before going back up.
Double tops are likely to be bearish because it means price was unable to break above the previous high (and you could also look at it as price bouncing off of previous resistance, which is bearish).
Double bottoms are likely to be bullish because it means price was unable to go beneath the previous low (and you could also look at it as price bouncing off of previous support, which is bullish).
Now, is this enough off of which to build a trading system?
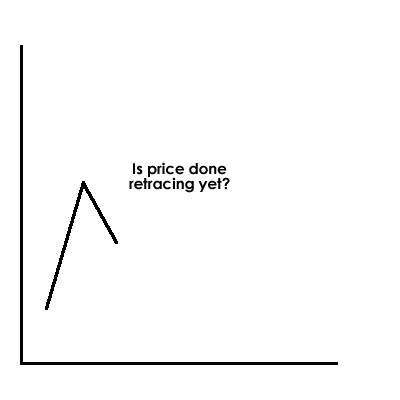
There are a few problems with this.  Let’s say you were going to trade an uptrend that was formed by HHs and HLs.  Price starts going up and forms a high, and then it starts retracing.
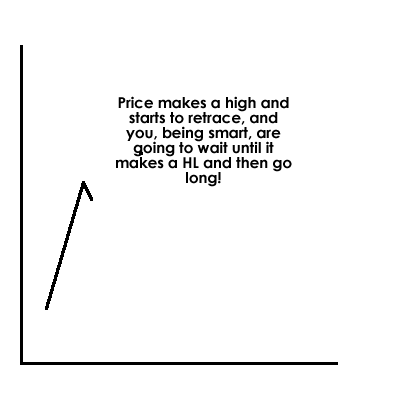
uptrend forming 1
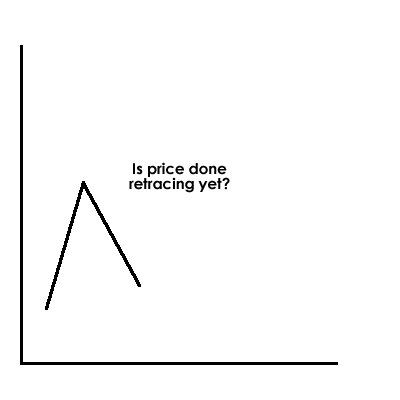
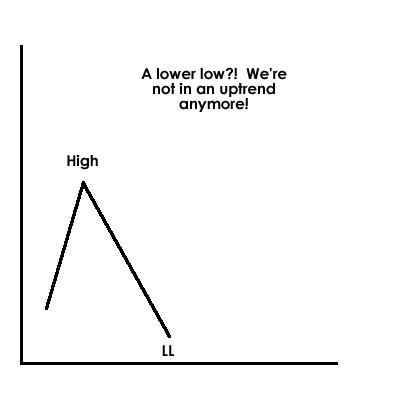
You are going to wait for the HL and then go long, but there is a problem: how do you know when price is done retracing and is going to go back up?  How do you know that retrace isn’t going to keep going down and form a lower low?
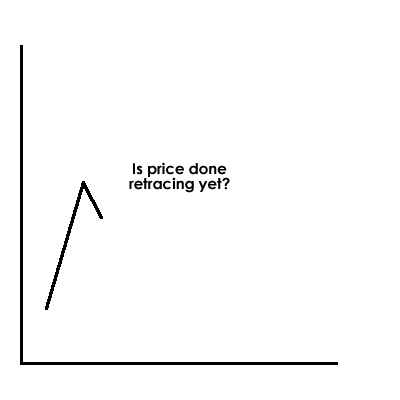
uptrend forming 2
Did you enter yet?
uptrend forming 3
Did you enter yet?
uptrend forming 4
Did you enter yet?
uptrend forming 5
Oh no, price formed a lower low!  Looks like we’re not in an uptrend anymore.
Now we should be looking for a lower high to confirm the downtrend, right?
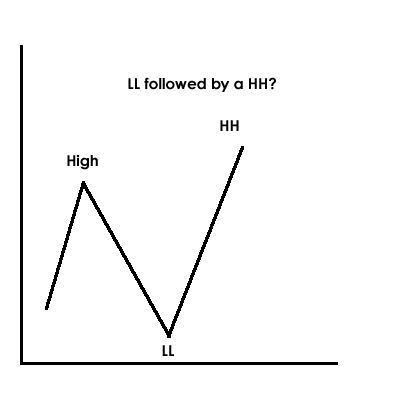
uptrend forming 6
A LL followed by a HH?!  How does that happen?!
People will come up with all sorts of rules, like:
- don’t enter long until a high, a HL, and another HH (this is supposed to “confirm” the uptrend)
- don’t enter long after more than 3 waves (as if after making 3 HHs, price won’t make another HH)
All of these rules are just things people make up because they don’t understand the random price of the market.
Sometimes price trends and makes beautiful HHs, HLs, and HHs.  If you can figure out when to enter (because the HL can form at any point), you can make money as long as you get out before price goes against you.  Be careful adding to winning trades because as soon as that retracement goes a bit too far, your winning trade can turn into a losing trade.
Sometimes price makes LL, HH, LL.
Sometimes price makes HL, LH, HL.
Price can do whatever it wants and doesn’t care what it has done in the past.
You will see people chime in on these kinds of discussions and say “well obviously you just don’t understand it” subtly implying that they do understand it, yet you will never see them make real time calls.  I wonder why?
Price can go wherever it wants, and unless you know ahead of time that it’s going to make a LH or whatever, there’s no way to know that a HL will follow a HH.  Here is a list of possible formations that can follow a HH:
- HL
- DB
- LL
(obviously a LH can’t follow a HH because a LH is formed when price is rising and if you’re already at an HH you can’t have a LH without some sort of low coming first).
Here’s a chart showing what can follow what.  Start with the vertical column and go across to see if a certain formation can follow it.
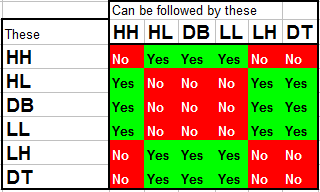
high low table

Fibonacci Retracement

How to Use Fibonacci Retracement to Enter a Forex Trade

The first thing you should know about the Fibonacci tool is that it works best when the forex market is trending.
The idea is to go long (or buy) on a retracement at a Fibonacci support level when the market is trending up, and to go short (or sell) on a retracement at a Fibonacci resistance level when the market is trending down.

Finding Fibonacci Retracement Levels

In order to find these Fibonacci retracement levels, you have to find the recent significant Swing Highs and Swings Lows. Then, for downtrends, click on the Swing High and drag the cursor to the most recent Swing Low.
For uptrends, do the opposite. Click on the Swing Low and drag the cursor to the most recent Swing High.
Got that? Now, let’s take a look at some examples on how to apply Fibonacci retracements levels to the currency markets.

Uptrend

This is a daily chart of AUD/USD.
Daily chart of AUD/USD with Fibonacci retracement levels
Here we plotted the Fibonacci retracement levels by clicking on the Swing Low at .6955 on April 20 and dragging the cursor to the Swing High at .8264 on June 3. Tada! The software magically shows you the retracement levels.
As you can see from the chart, the Fibonacci retracement levels were .7955 (23.6%), .7764 (38.2%), .7609 (50.0%), .7454 (61.8%), and .7263 (76.4%).
Now, the expectation is that if AUD/USD retraces from the recent high, it will find support at one of those Fibonacci retracement levels because traders will be placing buy orders at these levels as price pulls back.
Now, let’s look at what happened after the Swing High occurred.
Fibonacci Retracement: 38.2% Fib level held as support
Price pulled back right through the 23.6% level and continued to shoot down over the next couple of weeks. It even tested the 38.2% level but was unable to close below it.

Later on, around July 14, the market resumed its upward move and eventually broke through the swing high. Clearly, buying at the 38.2% Fibonacci level would have been a profitable long term trade!

Downtrend

Now, let’s see how we would use the Fibonacci retracement tool during a downtrend. Below is a 4-hour chart of EUR/USD.
4-hour chart of EUR/USD with Fibonacci retracement levels
As you can see, we found our Swing High at 1.4195 on January 25 and our Swing Low at 1.3854 a few days later on February 1. The retracement levels are 1.3933 (23.6%), 1.3983 (38.2%), 1.4023 (50.0%), 1.4064 (61.8%) and 1.4114 (76.4%).
The expectation for a downtrend is that if price retraces from this low, it could possibly encounter resistance at one of the Fibonacci levels because traders who want to play the downtrend at better prices may be ready with sell orders there.
Let’s take a look at what happened next.
Fibonacci Retracement: 50.0% Fib level held as resistance
Yowza, isn’t that a thing of beauty?!
The market did try to rally, stalled below the 38.2% level for a bit before testing the 50.0% level. If you had some orders either at the 38.2% or 50.0% levels, you would’ve made some mad pips on that trade.
In these two examples, we see that price found some temporary forex support or resistance at Fibonacci retracement levels. Because of all the people who use the Fibonacci tool, those levels become self-fulfilling support and resistance levels.
One thing you should take note of is that price won’t always bounce from these levels. They should be looked at as areas of interest, or as Cyclopip likes to call them, “KILL ZONES!” We’ll teach you more about that later on.
For now, there’s something you should always remember about using the Fibonacci tool and it’s that they are not always simple to use! If they were that simple, traders would always place their orders at Fibonacci retracement levels and the markets would trend forever.
In the next lesson, we’ll show you what can happen when Fibonacci retracement levels fail.


Read more: http://www.babypips.com/school/elementary/fibonacci/fibonacci-retracement.html#ixzz3kgezp2ig

Elliott Wave Principle Basics

Motive Wave: 

proElliottWave.com Motive

Rules:

  • Impulsive Waves always divide into 5 waves: Waves 1,2,3,4,& 5; followed by a corrective wave, typically A, B & C.
  • The waves that are numbered (1,2,3,4,5) are in the direction of the Trend.
  • The waves that are Lettered (A, B, C ) are against the Trend.
  • Structure = 5-3-5-3-5 (21) followed by 5-3-5 (13)
  • Wave 1 could divide into an impulsive 5 wave or a Leading Diagonal.
  • Wave 3 is always an Impulsive 5 wave and is never the shortest wave.
  • Waves 5 & C are always 5 waves but it could be an Ending Diagonal.
  • Wave 2, 4 and B always subdivide in 3 wave corrections.
  • Wave 2 Never moves beyond origin of Wave 1.
  • Wave 3 must go beyond Wave 1.
  • Wave 4 never moves into wave 1 range.
  • Wave A can be a three wave structure or Leading Diagonal.
  • Wave 5 often goes beyond Wave 3, if not it is called "Truncation".
  • The Chart shows a bull Market. For a Bear Market the chart can be flipped and all the rules remain the same.
  • The same pattern can be viewed in all time frames: Thick Charts, 1 min, 2 min, 3 min, 5 min, 10 min, 15 min, 30 min, 1 h, 4h, Daily, Weekly, Monthly Charts etc...

Guidelines:

  • Waves 2 & 4 will almost always Alternate into ZigZags, Flats, or Combos.
  • Wave 4 can be Flats, Triangles or Combinations 
  • Wave 2 which is usually ZigZag or a ZigZag combination.
  • Wave 4 Usually Terminates in the same area as the Previous Wave 4 of Wave 3.
  • Typical Fib counts for Wave 2 is 50%, 61.8% of Wave 1.
  • Typical Fib Count of Wave 4 is 38.2% or 61.8% of wave 3.
  • See the charts for other Fibonacci relations.
  • Often Waves ad-hear to the laws of Channeling:
  • 5 ends around the Chanel line extension of endpoints of 1-3, and
  • Wave 4 may end at the parallel line point 1-3. (please look at the charts)

Tuesday, September 1, 2015

5 of Wave C


FOR EDUCATIONAL PURPOSE ONLY!


Possible target wave 5 at 1448 area... should hit by end of SEPT!

Tuesday, August 25, 2015

TRADING? HERE ARE 10 THINGS YOU SHOULD CONSIDER

https://www.tradingview.com/chart/EURUSD/cBlHaLuP-Trading-Here-are-10-Things-You-Should-Consider/

1. Trading is not a get rich quick scheme. It is a normal investment that gets traders return on capital. 
Have you ever met a trader making double-digit percent return per month on a consistent manner? 

Trading professionally with proper money management would likely get you a return of few percents a month. From my personal experience a 3-5 percent return on capital per month is a very realistic number. 

So if you’re that kind of person who wants to “make a killing” trading, please reconsider your expectations. 

2. You should be well-capitalized. Small accounts will probably burn you. 
This point is correlated to the first one. let me illustrate with an example: 

Suppose that you have a $30,000 trading account. According to the 3-5 percent return per month rule, that would give you 1000-$1500 return per month, which is a very good number, relatively speaking. 

Now let’s assume that you have a $5,000 account, according to the 3-5 percent rule, that would return 150-$250 per month. 

In the second example(smaller equity), the return would likely be unsatisfying for someone looking to trade for a living. Would it be for you? Wouldn't you break your money management rules and take more risk to increase that return? 

3. Technical Analysis doesn't work all the time. 
Assumptions we make will always have a percentage of failure. The main goal is to keep your risk limited, your targets bigger than your risk, looking for consistent profit on the long run. 

4. Trading is not about forecasting the market. 
Do not try to forecast where markets are headed all the time. What a trader does is wait for the market to GIVE him certain conditions that validate a trade. (Don’t trade under the market rules, trade under your rules.) Do you feel sometimes that you're lost and don’t know what to do? it's probably because of this. 

5. Limit your risk. 
If you did use stop loss on your trades within the past year, but you didn't and took excessive risk only on one trade, this single trade might wipe out all of the profits you gained through the year. 

How many times did you ignore your stop loss convincing yourself that you will close at a better price? It may have worked sometimes, but what if the price goes against you more and more? Are you mentally strong enough and able to close at a bigger loss? You probably won’t, until forced to close on a margin call. 

6. Don’t over analyze. 
Over analysis and complicating your tools will lead to confusion and is not necessarily efficient. 

7. Ignore your bias 
Initiating a trade requires technical evidence, three, four or five conditions that occur concurrently. 

8. Always use a top-down analysis approach. 
Start from the higher time frame to the lower time frame. The higher the time frame the more strong and invulnerable the trend is, and the more strong and invulnerable the support and resistance levels are. 

9. Trend-trading increases your chances of success. 
Trading setups that occur within the context of the trend tend to have a higher success rate than those against it. 

10. Don’t give up when you encounter a losing streak 
Yeah it can go up to 10 losing trades… Don’t worry, it’s normal in trading.