It doesn’t really matter if it’s a 4-hour chart since the markets are fractal this could be a gold chart or
S&P or particular stock or a different time frame. Learn the patterns, internalize them and then use
them in your trading.
Distinct Personality of each Wave
Ref:
Waves 1 and 2
When we start a move we call that Point zero.
Eventually if we have 5-wave sequence we are getting to Point T or the termination point.
When we start off we are at the market bottom
o Traders are Less emotional
o Still ambivalent because the market is still bearish at this point
o No change in trend is evident
o Traders are still looking for levels to sell not recognizing that market has turn around
Once you learn Elliott wave analysis you will learn the trend and you will learn to find Point zero
Wave 1 is like a sluggish move up
o Traders are complacent
o They are looking for new clues which they think will be down again
o Wave 1 moves in 5 ways
Wave 2
o Traders are bearish so they continue to sell
o Wave 2 moves are usually sharp move down correcting most of wave 1
o We typically see our double bottoms
o Price doesn’t go below the start of wave 1 and shoots up from there in wave 3
Wave 3 and Wave 4
Wave 3
o Wave 3 is your powerful uptrend; an emotional thrust; most often longest and strongest
o Greatest for profit potential
o Prechter calls it a “wonder to behold”
o Traders can make the most money here; it’s like throwing a dart at a target; it’s impossible
to miss
o If a trader gets in too late that’s another story
o There are many opportunities to get in the Wave 3 and you need to look for signals and
signs that it is running
o Market is confident
o time to max out on your positions
Wave 4
o Wave 4 is about profit taking
o Early traders who got in to this move are taking profits and there are others who are going
long, waiting for the wave 5
o What you have is whipsaw price action
o You have different corrective moves in Wave 4 that cause some traders to get in and some
traders to get out
S
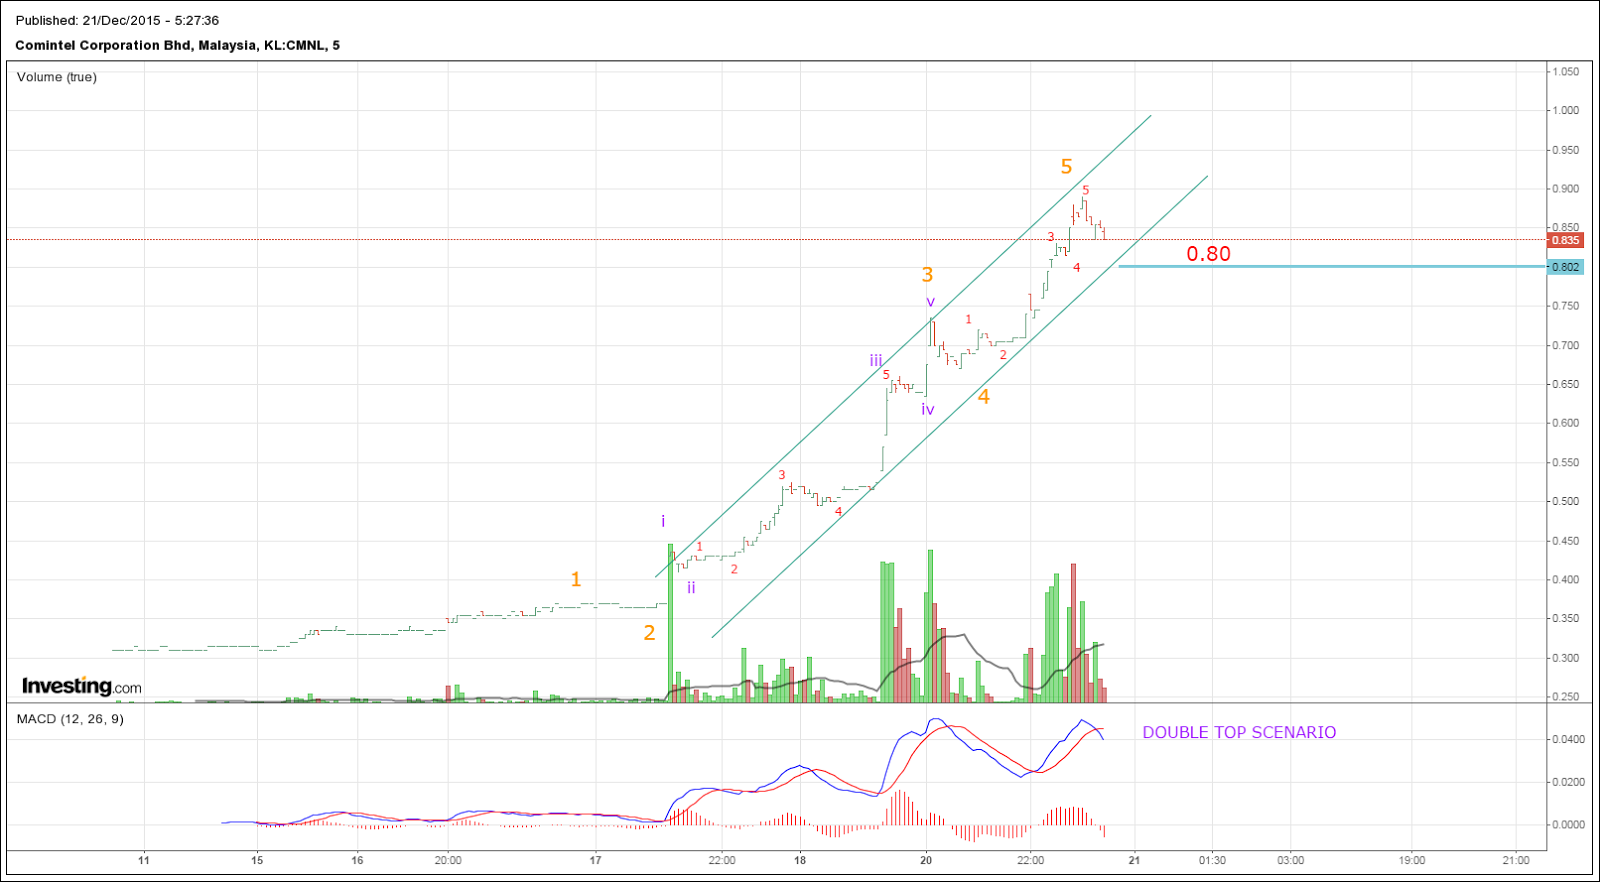
Wave 5
Wave 5
o The final advance
o Driven by greed
o Bullish sentiment is still present although waning
o Smart money is out
What are traders doing in Wave 5
o If they are bullish in Wave 3 they are bullish in Wave 5 because the market keeps going
up
That could be a bit dangerous because
o Wave 5 is the final advance
o It is the last struggle to create new high prices
o that’s where you see momentum divergences
o and you see 5th wave failures, double tops and blow-ups
This is point T or termination point and you need to target Wave 5 using Fibonacci tools,
channelling techniques and try not to follow the crowd
With trading you need to be smart with your money and not buy after it already moved up. You
want to be buying before it moves up or during the mov