30-3-2016

Likely wave B play... might test 1726 or higher tomorrow to complete B.
29-3-2016

25-3-2016

22-3-2016

21-3-2016

20-3-2016

15-3-2016

14-3-2016

10-3-2016

9-3-2016

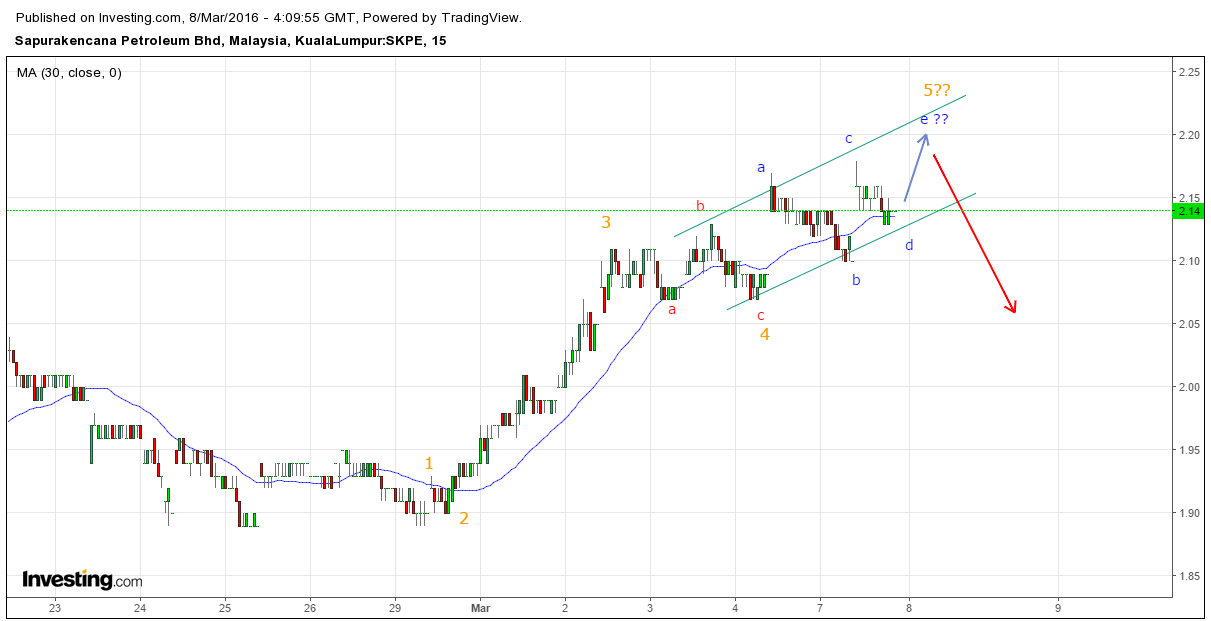
8-3-2016

7-3-2016

4-3-2016

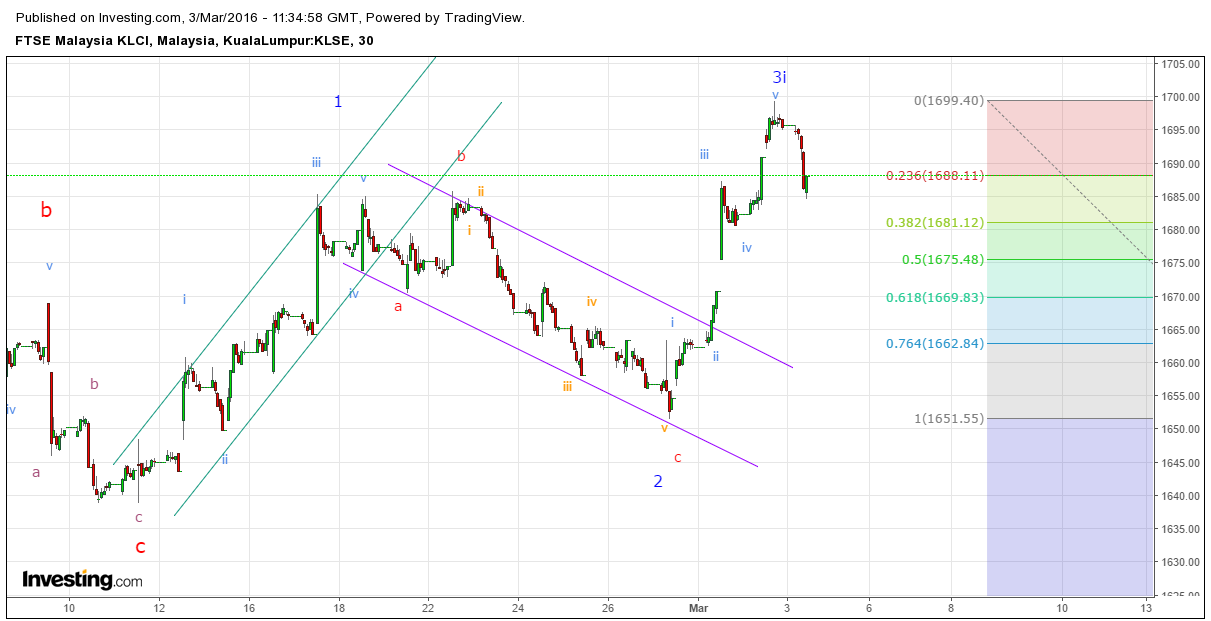
3-3-2016

Likely wave B play... might test 1726 or higher tomorrow to complete B.
29-3-2016

25-3-2016

22-3-2016

21-3-2016

20-3-2016

15-3-2016

14-3-2016

10-3-2016

9-3-2016

8-3-2016

7-3-2016

4-3-2016

3-3-2016
2-3-2016

1-3-2016